› Results
The Proof Is in The Rankings.
Real clients. Real results. We'll keep adding to this page.
› Featured Case Studies
› Real Client Snapshots
From Page Two to Map Pack Dominance.
Side-by-side GMB grid scans. Lower AGR = higher average rank. Higher SoLV = more visibility across the local map.
Nelson-Dye Remodeling Specialists
› Keyword: remodel fresno
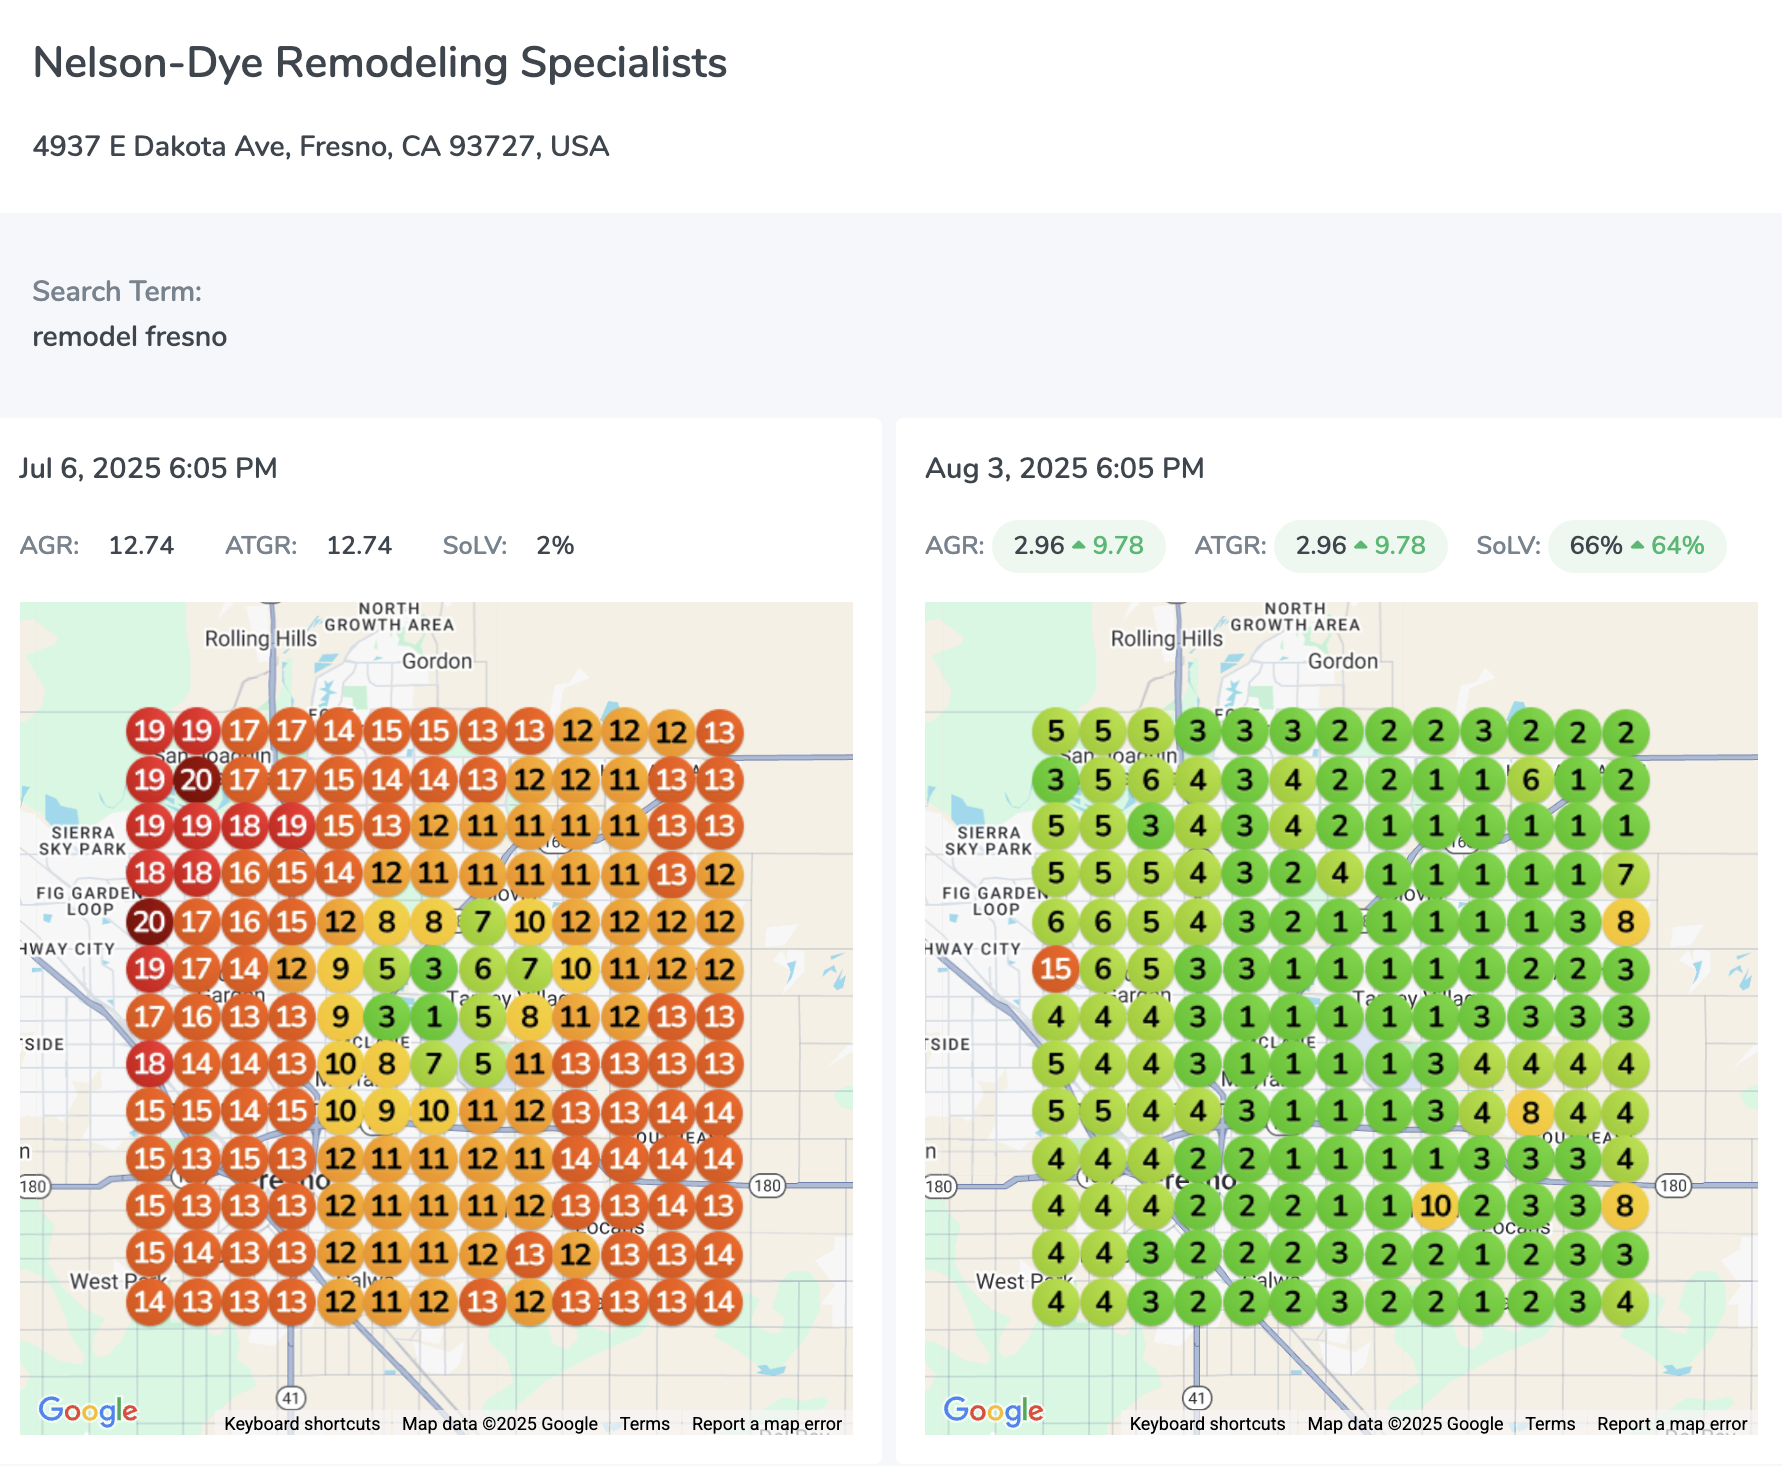
AGR
ATGR
SoLV
EveryDay Junk Removal & Hauling
› Keyword: junk removal fresno
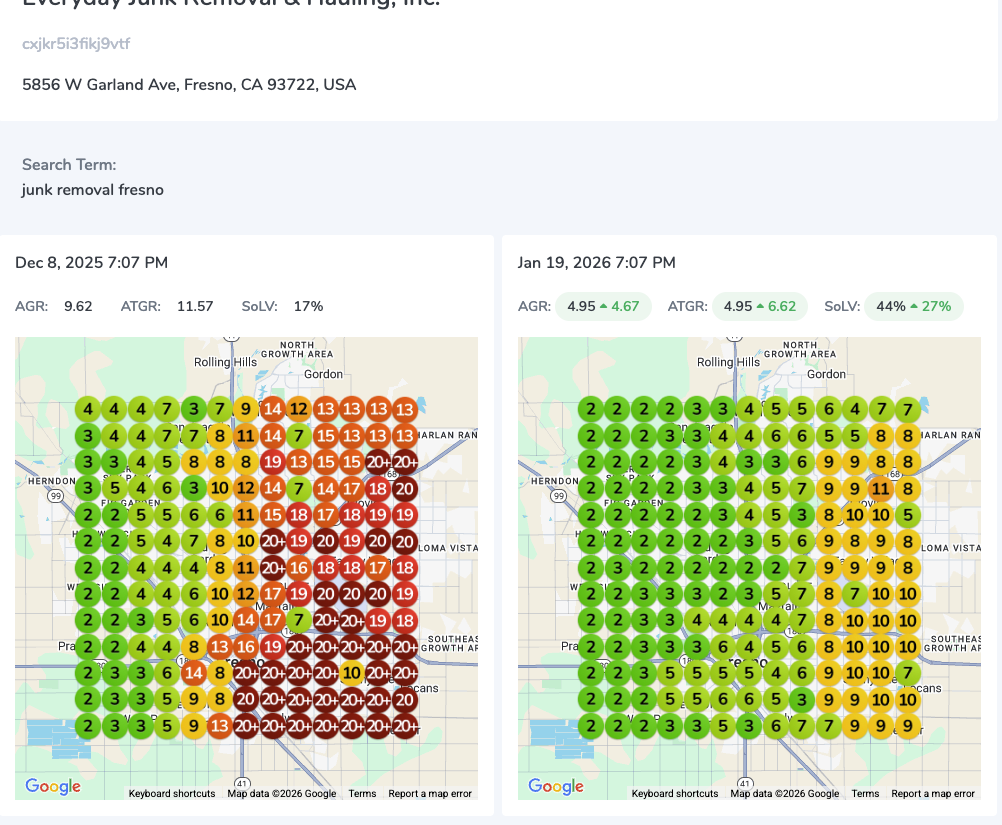
AGR
ATGR
SoLV
Solar Installation Client
› Keyword: solar installation
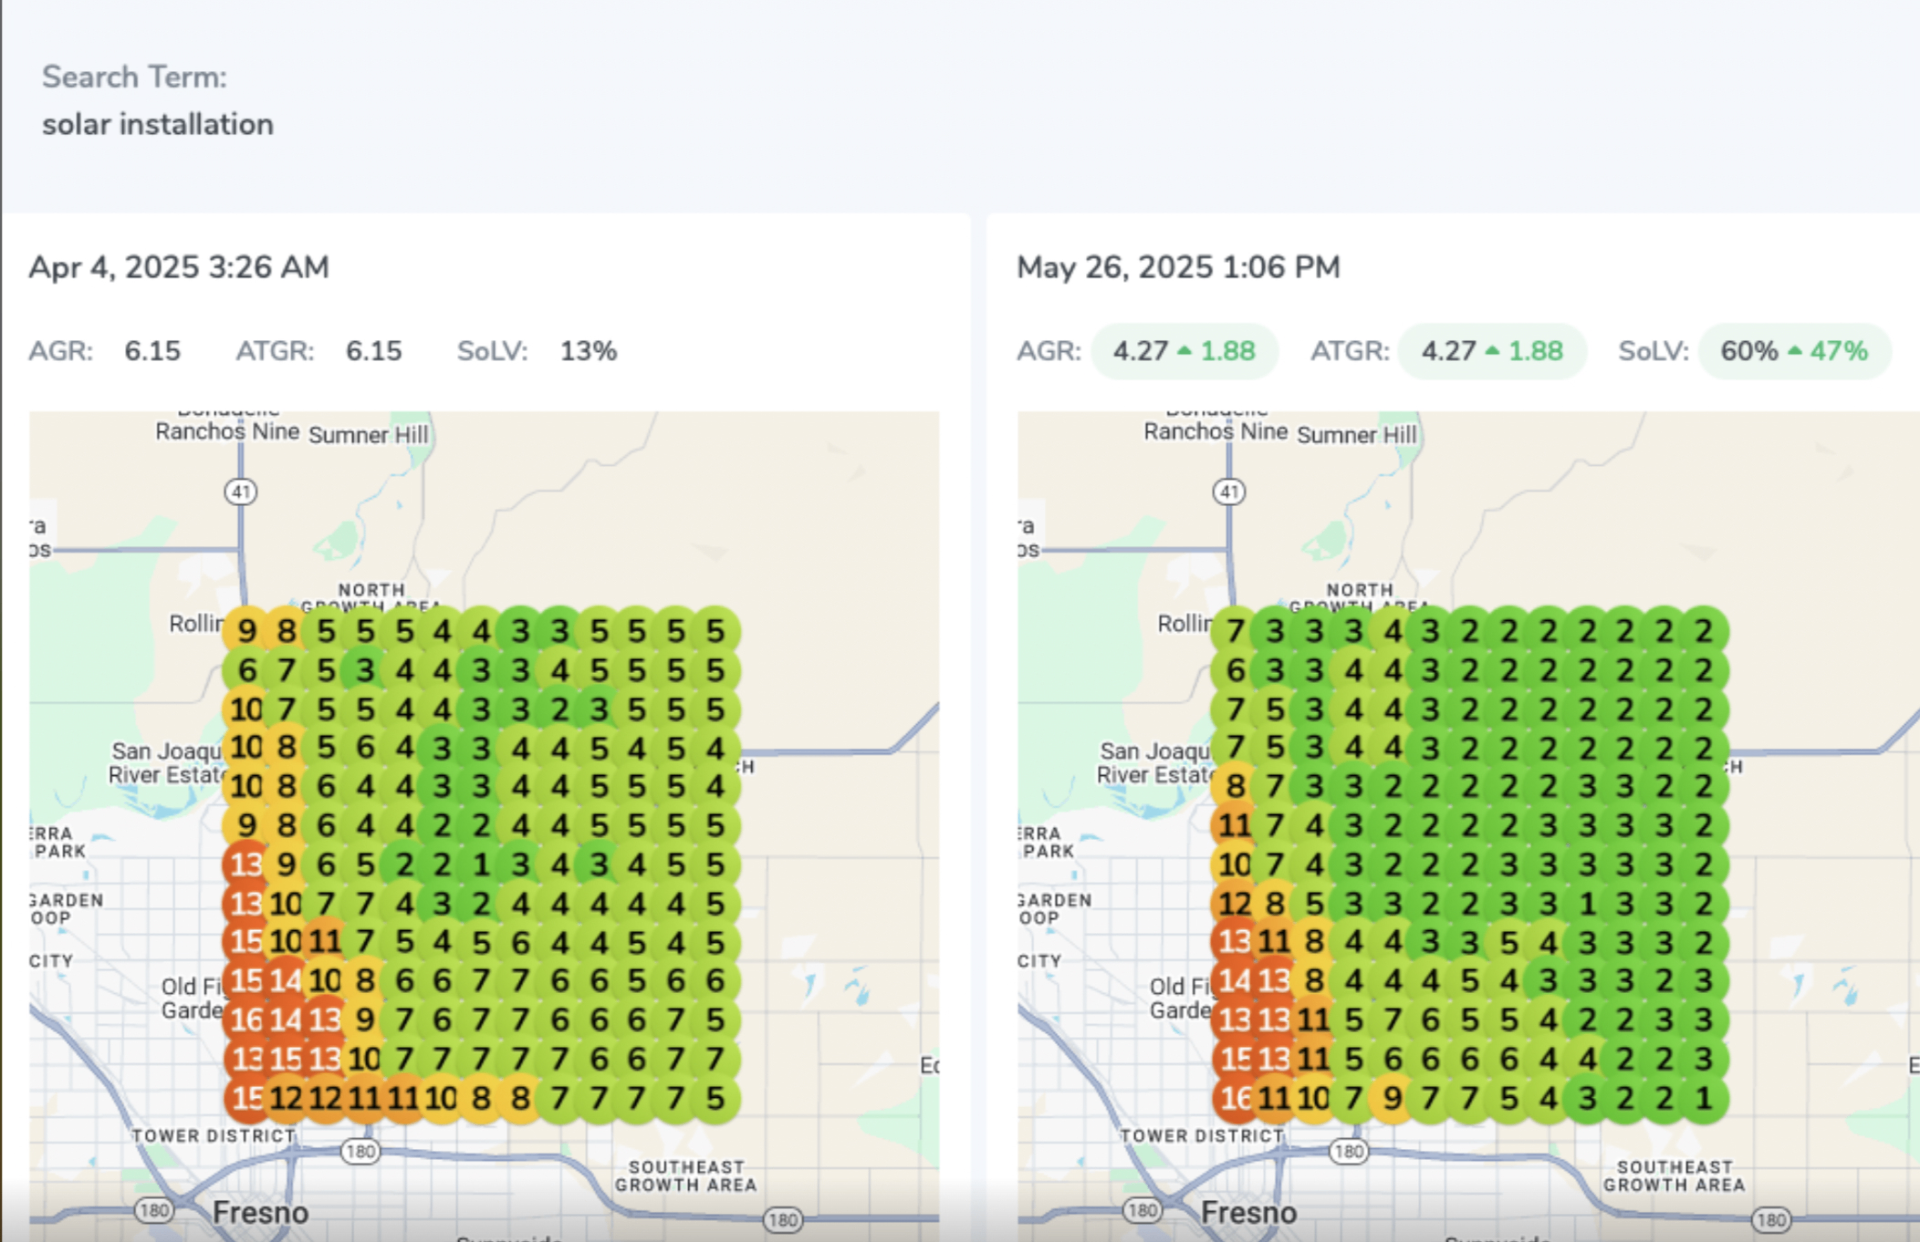
AGR
ATGR
SoLV
› Real Ad Account Snapshots
Real Conversions. Real Cost-Per-Lead.
Pulled straight from the Google Ads dashboard. More leads, lower CPA, every quarter.
Solar Installation Client
› Jun 16 – Oct 13, 2025
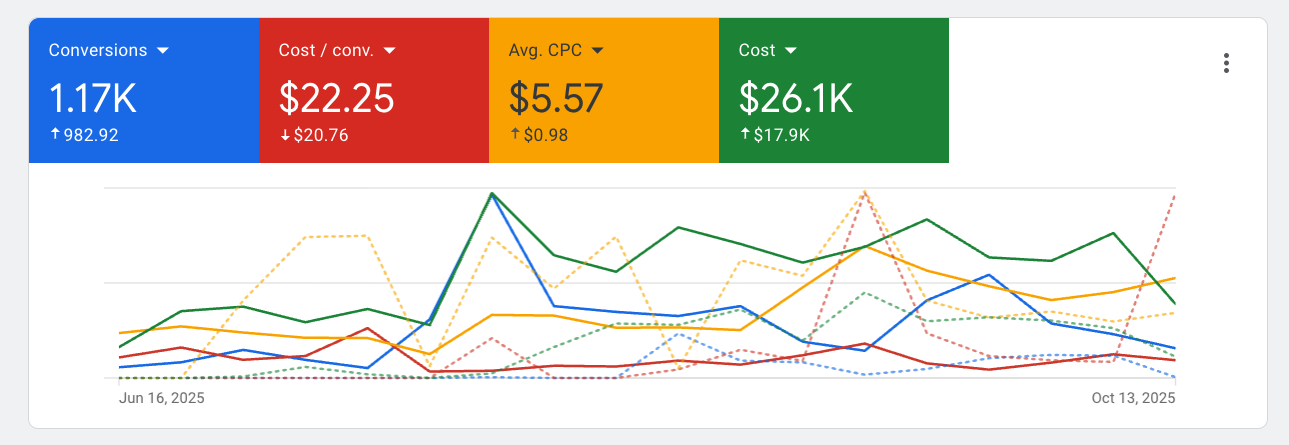
Conversions
1.17K
↑ 982.92
Cost / Conv.
$22.25
↓ $20.76
Avg. CPC
$5.57
↑ $0.98
Cost
$26.1K
↑ $17.9K
HVAC Client
› Jul 18 – Oct 16, 2025
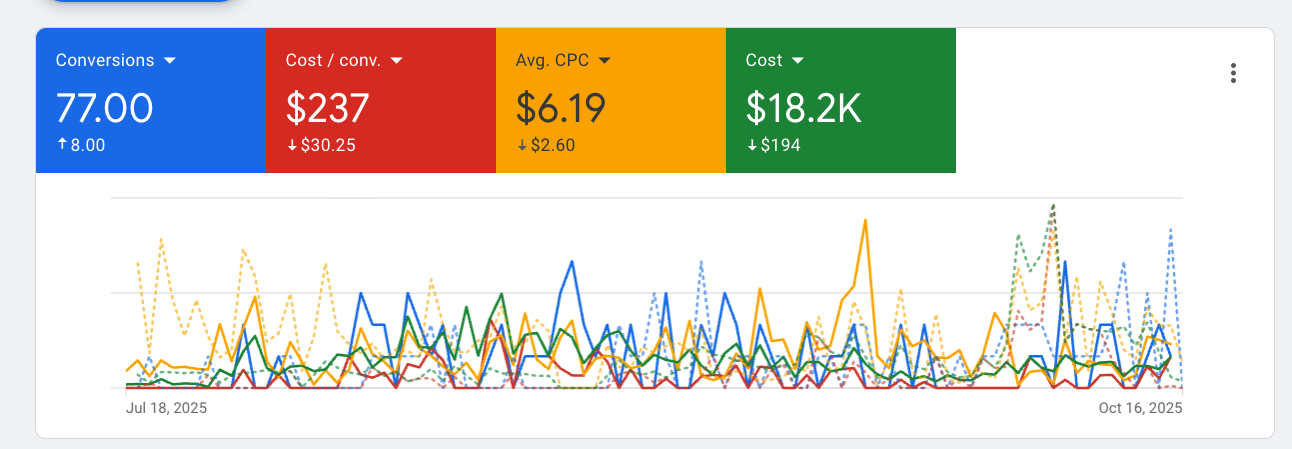
Conversions
77
↑ 8
Cost / Conv.
$237
↓ $30.25
Avg. CPC
$6.19
↓ $2.60
Cost
$18.2K
↓ $194
Paving Company
› Jul 18 – Oct 16, 2025
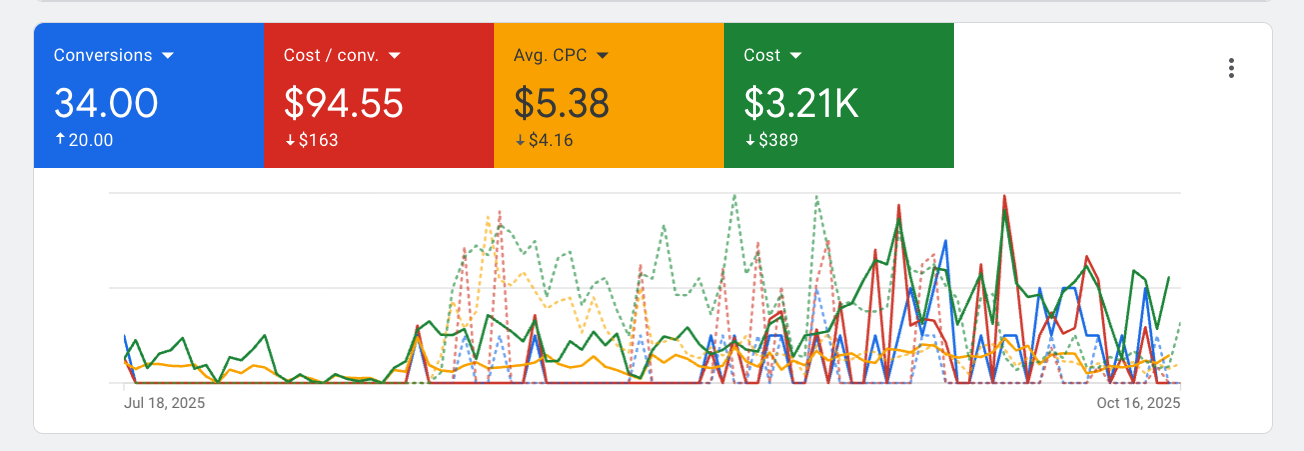
Conversions
34
↑ 20
Cost / Conv.
$94.55
↓ $163
Avg. CPC
$5.38
↓ $4.16
Cost
$3.21K
↓ $389
Commercial Contractor
› Jun 16 – Oct 13, 2025
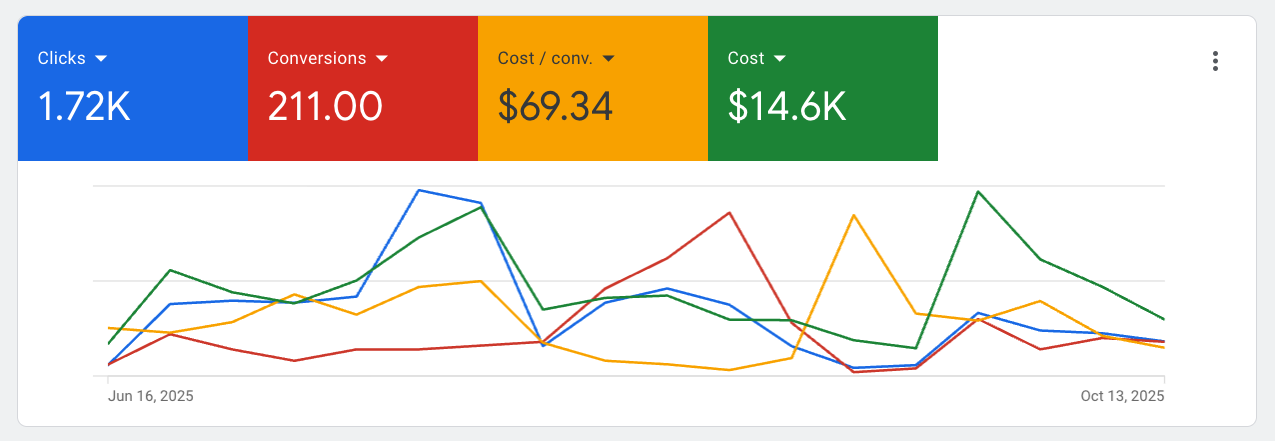
Clicks
1.72K
Conversions
211
Cost / Conv.
$69.34
Cost
$14.6K
› Real SEO Account Snapshots
Real Rankings. Real Compounding Growth.
Pulled from live SEO tracking dashboards. Performance index, visibility, and GBP engagement — month over month.
Long-Range SEO Client
› Nov 2023 – May 2025
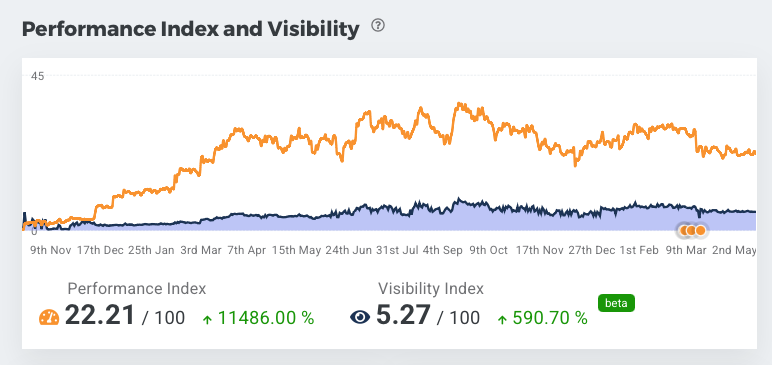
Performance Index
22.21 / 100
↑ 11,486%
Visibility Index
5.27 / 100
↑ 590.70%
Two-Week Ramp
› Jun 15 – Jun 30
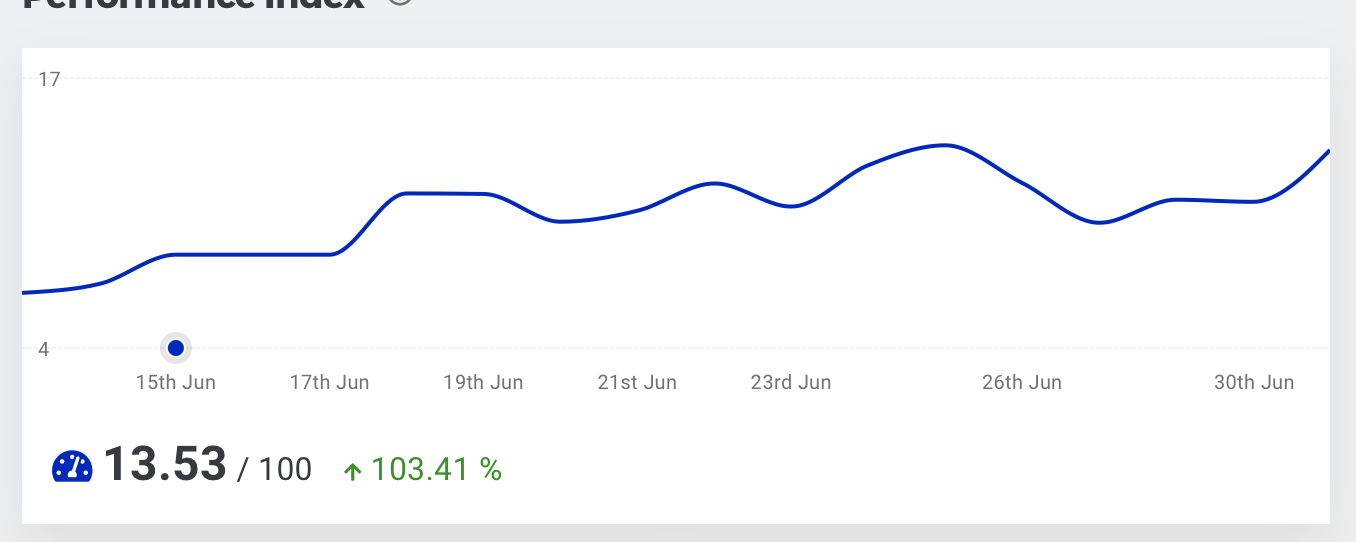
Performance Index
13.53 / 100
↑ 103.41%
From-Zero Launch
› Launch → Oct 6
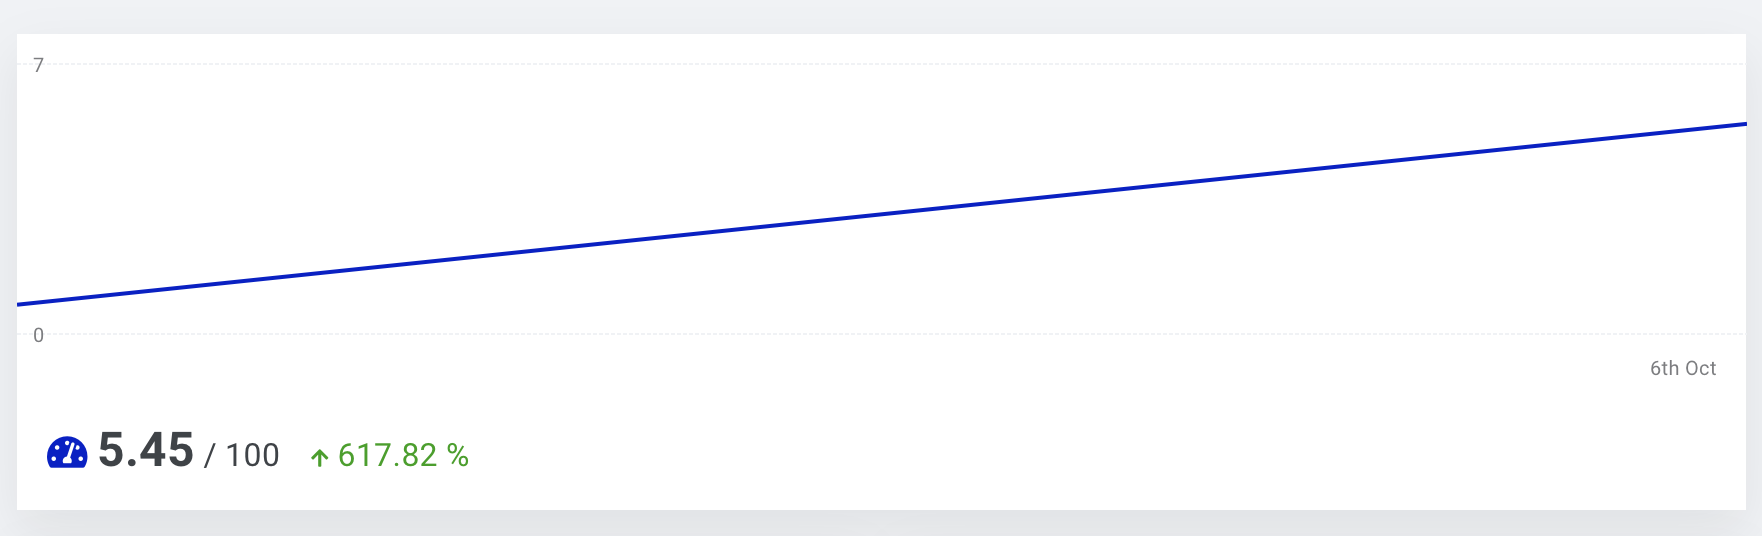
Performance Index
5.45 / 100
↑ 617.82%
GBP Engagement Lift
› Jun 2025 vs Jun 2024
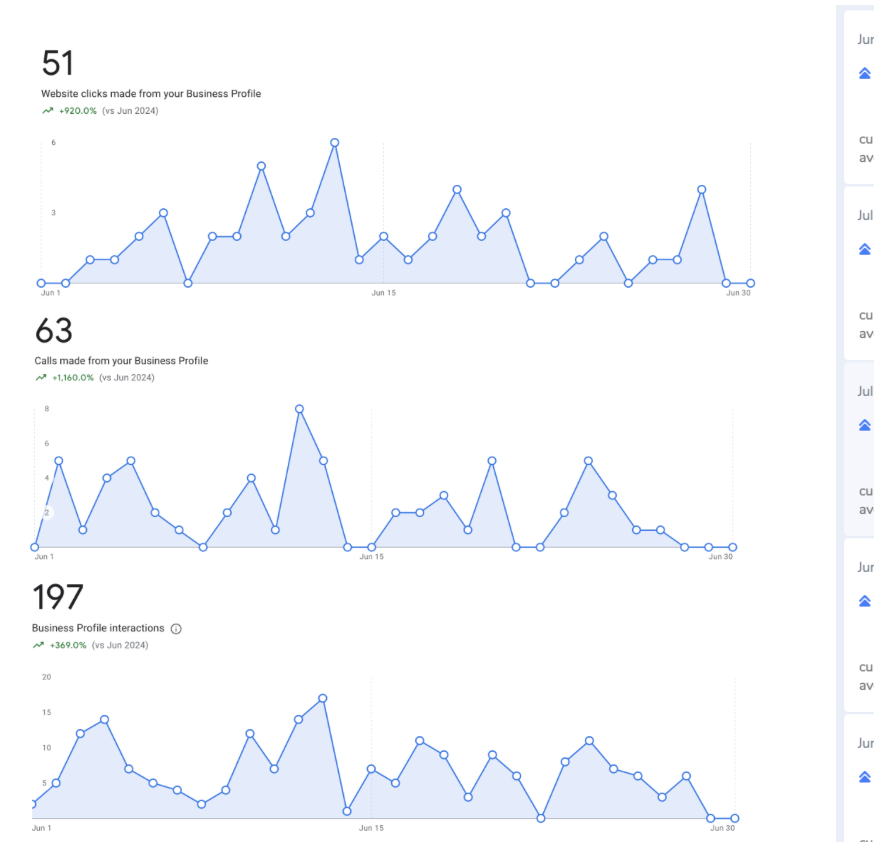
Website Clicks
51
↑ 920%
Calls
63
↑ 1,160%
Profile Interactions
197
↑ 369%